V-FINDER V2
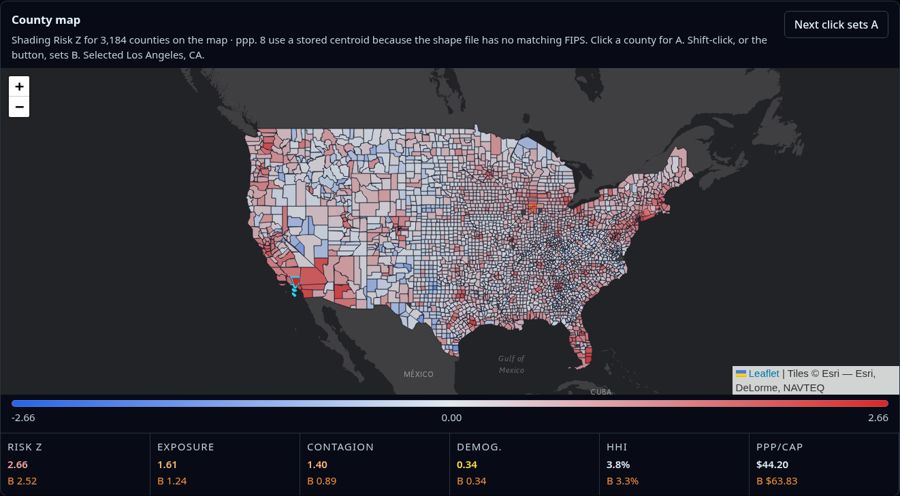
A free map of PPP loan risk built from public data. It ranks all 11.47 million PPP loans by traits they share with publicly charged fraud cases, so reviewers can decide where to look first.
See a place? Question it.
Typos are OK. Statistical risk indicators, not accusations.
90-second demo: county map, risk profile, loan search, county audit.
What it does
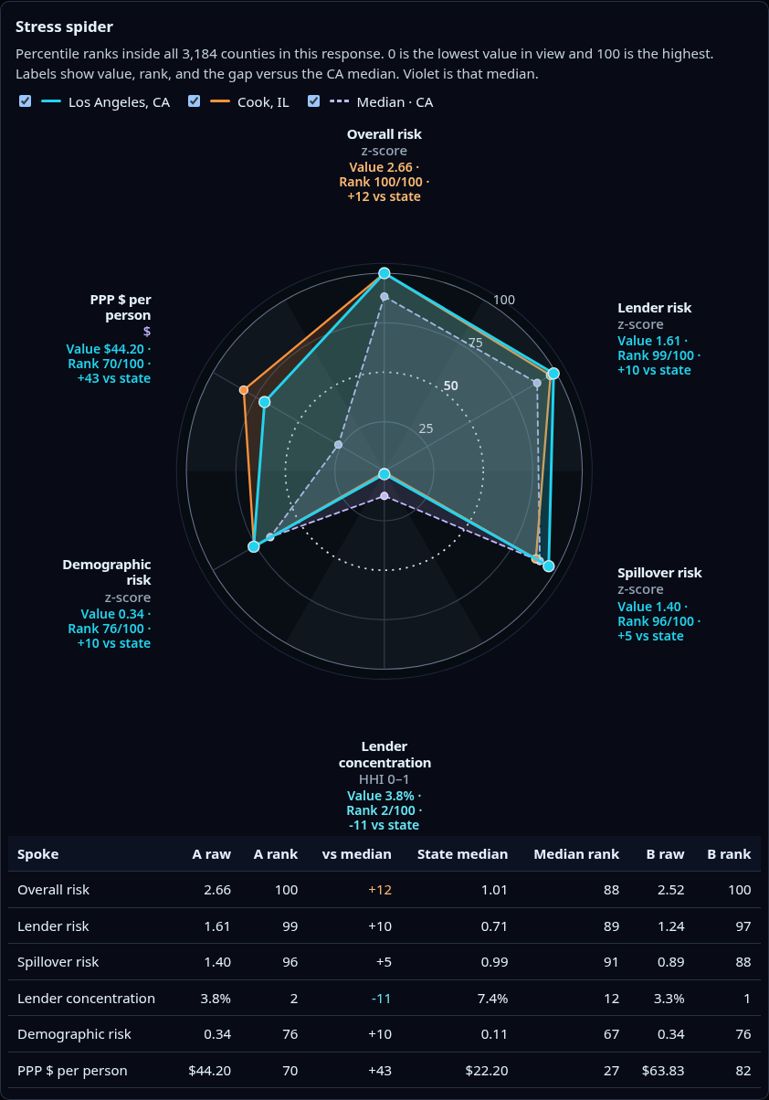
- County risk maps and spider-chart profiles
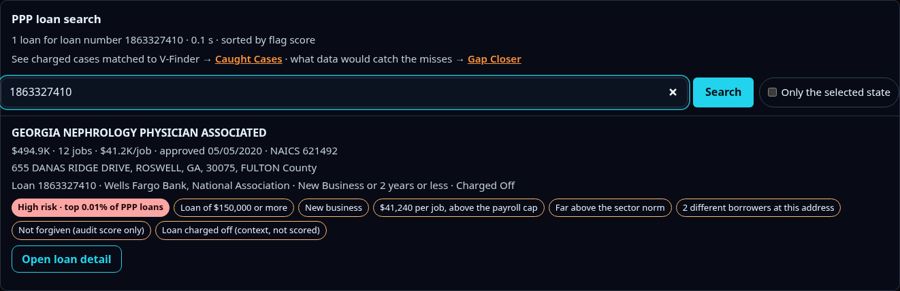
- Loan search by name or loan number, with a plain-English list of red flags
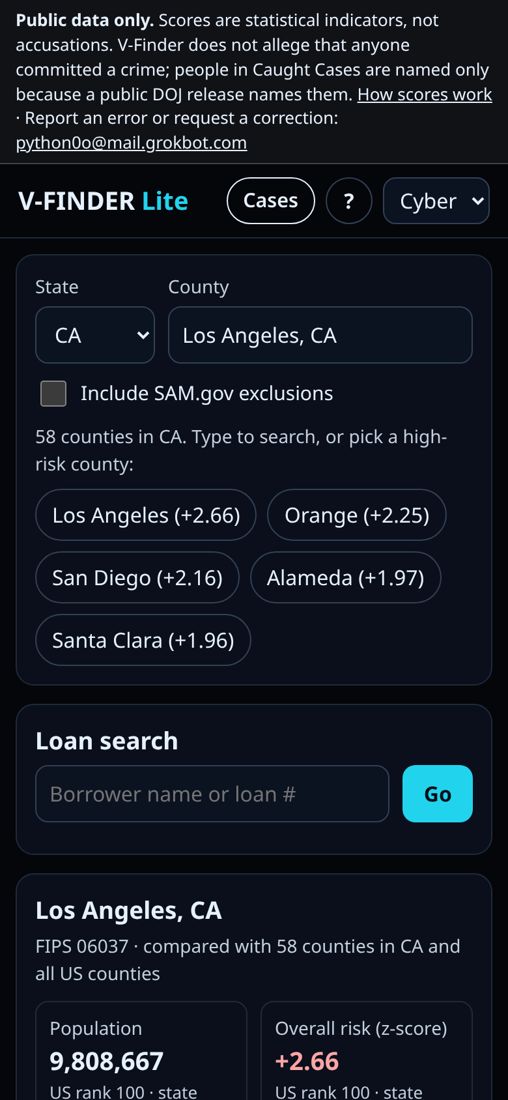
- County audits against SAM exclusions and OFAC
- Caught Cases: how charged loans score
- Gap Closer: what non-public data would catch the rest
Data (all public)
SBA PPP loan file (11.47M loans), SAM.gov exclusions, OFAC SDN, FEC, IRS exempt orgs, SBA 7(a)/504, USDA, Restaurant Revitalization Fund, Census ACS, and some state business registries.
How well it works
On 125 held-out charged loans, the application score catches 21% while flagging 0.9% of all loans, 33% at 2% and 38% at 4%. Adding forgiveness status raises that to 44%, 47% and 53%.
It misses most small sole-proprietor, stolen-identity and fake-document fraud, and most flagged loans are legitimate. Known gaps.
Built by Pat Callahan, Nashua, NH · @python0o · python0o@mail.grokbot.com · v-finder.info
Report an error or request a correction: email python0o@mail.grokbot.com. Corrections are reviewed and fixed or removed promptly.